Last Chance to Buy Bitcoin Under $70K, Says Analyst PlanB!
-
 Written by
Yana Levkovich
Written by
Yana Levkovich - Updated 2026-02-06 17:07:31
Quant analyst PlanB says Bitcoin (BTC) looks like it did in 2017 before its big rise.
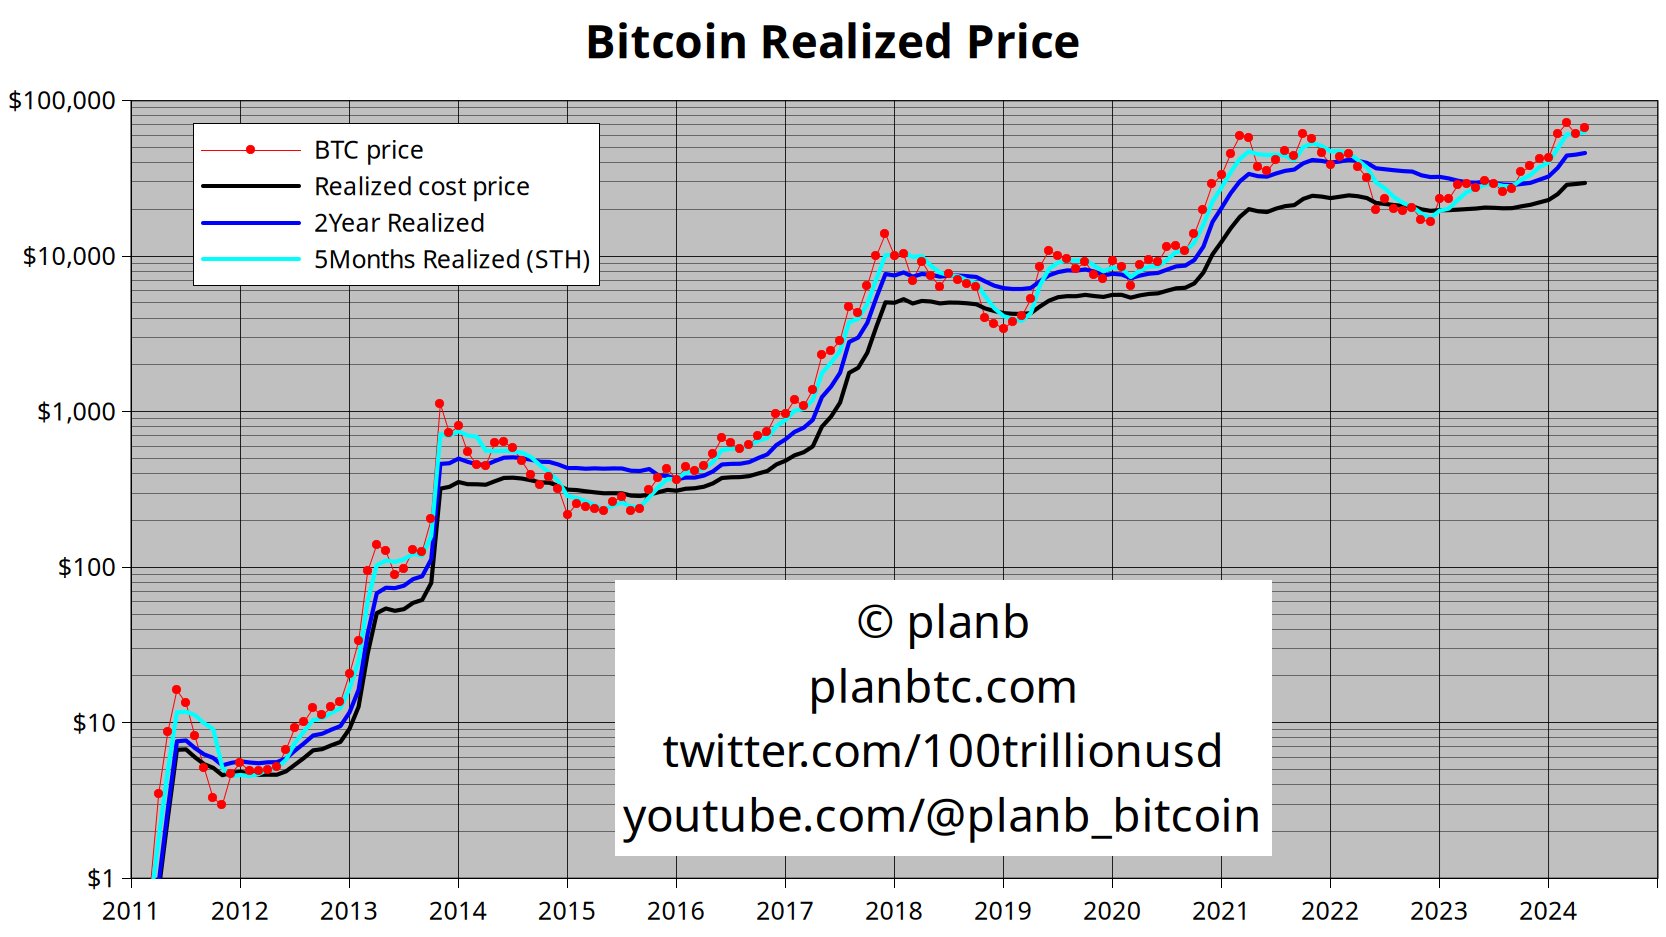
PlanB shares with his 1.9 million followers on X that BTC is four months into its bull market. He points to the four red dots on his chart as proof.
“2017 vibes.”
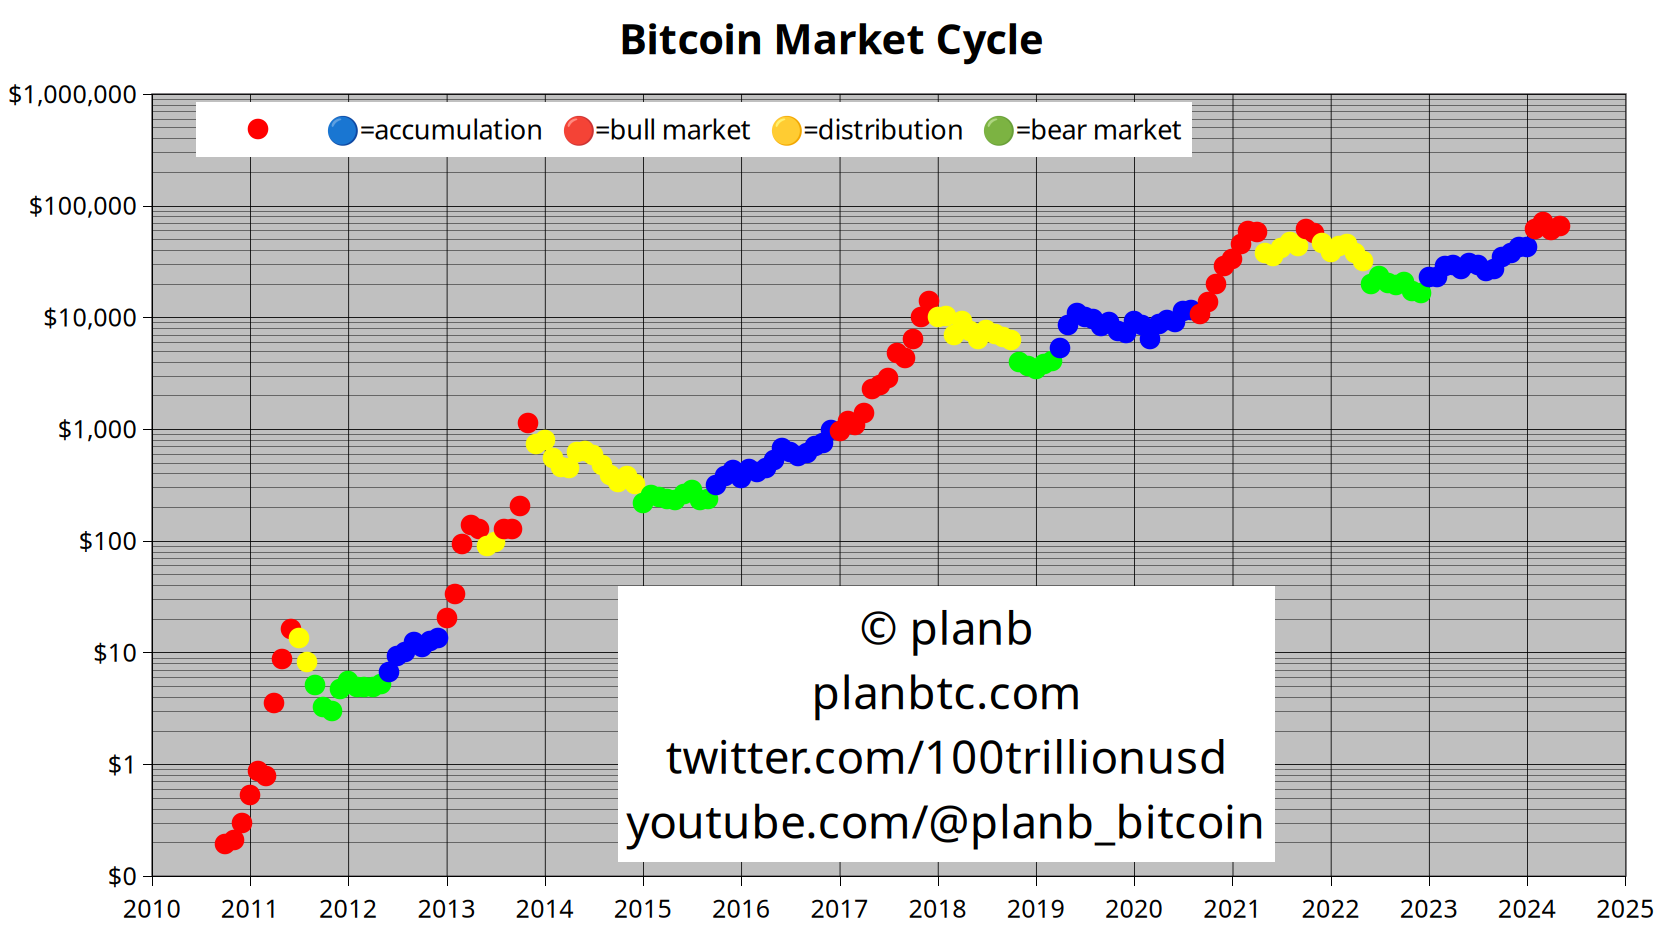
In 2017, when BTC hit its fourth red dot, it was trading at about $1,200. It then surged to $20,000 by the year's end.
PlanB is also examining different versions of Bitcoin’s realized cost price indicator. This metric shows the value of a group's coins based on their last transaction price. His chart includes the five-month, two-year, and total realized cost price of BTC.
The chart indicates BTC’s price is above all three metrics. This suggests BTC may soon move away from its current levels.
“Last chance to buy Bitcoin below $70,000?”
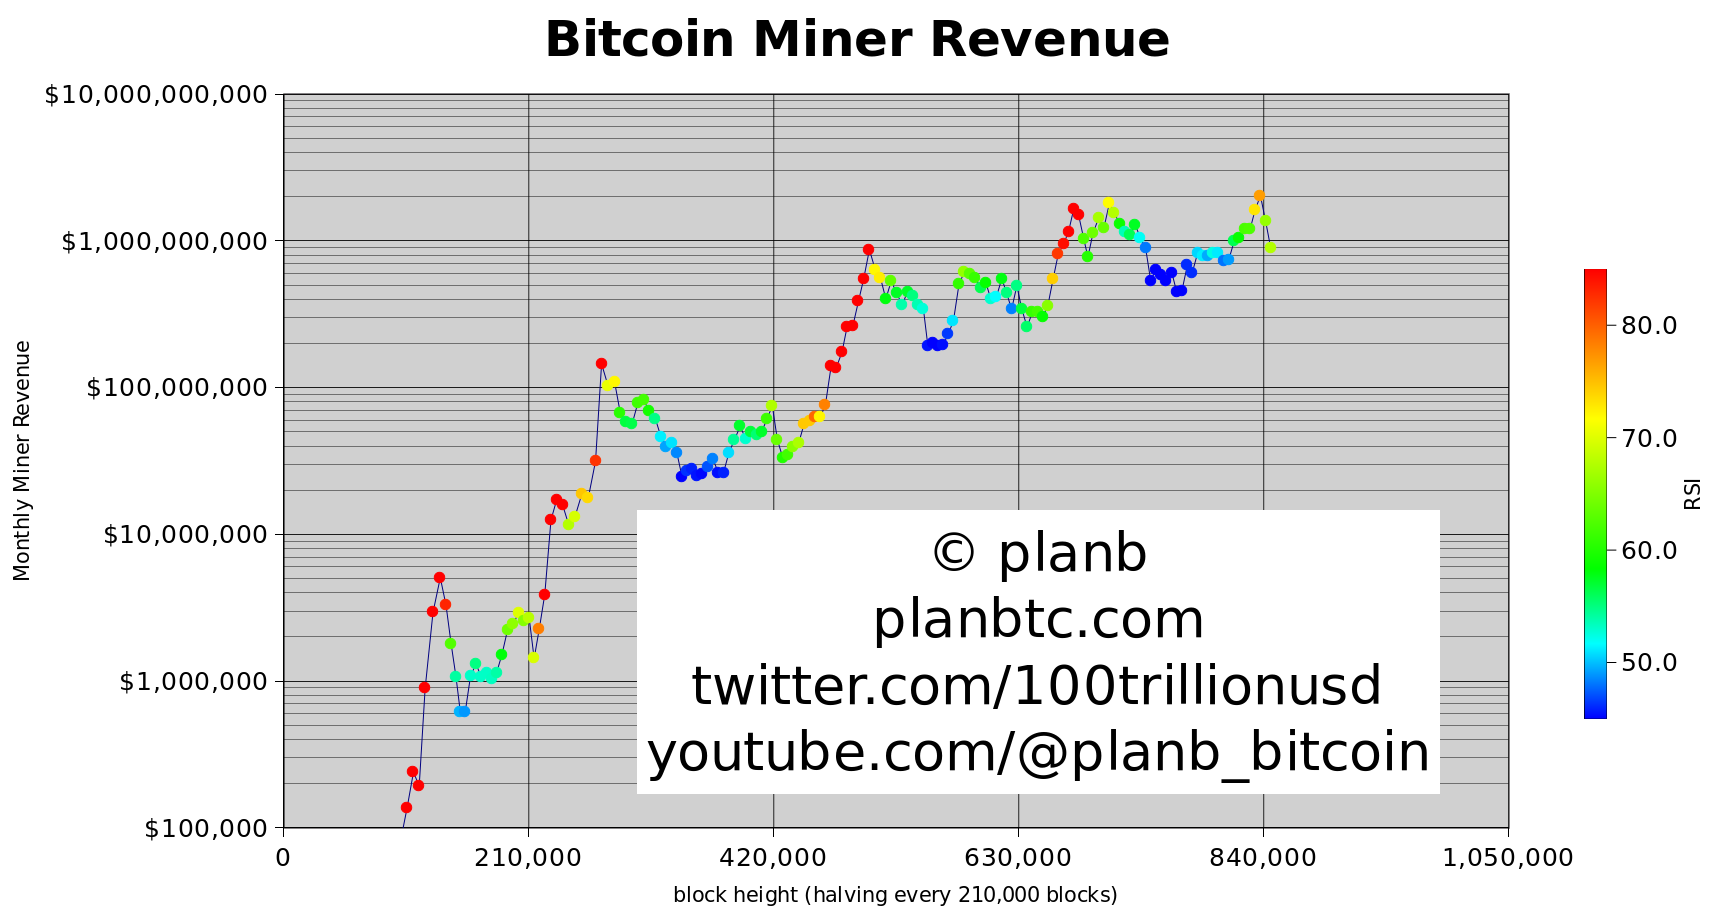
PlanB adds that, historically, there's a link between miner revenue and BTC's price. He expects BTC to soar in late 2024 as miner revenue recovers from the halving.
“Historically, Bitcoin miner revenue recovers two to five months after a halving, and after that Bitcoin price goes vertical.”
Currently, Bitcoin is trading at $67,105.