Glassnode Founders Unveil Bitcoin’s Explosive Price Surge Pattern and Bold Target
-
 Written by
Rahul Nambiampurath
Written by
Rahul Nambiampurath - Updated 2024-02-13 20:12:56
The co-founders of Glassnode, a prominent crypto analytics firm, are envisioning a potentially transformative trajectory for Bitcoin (BTC) based on a recurring pattern. Emphasizing the adage “History doesn't repeat itself, but it often rhymes,” often attributed to Mark Twain, Jan Happel and Yann Allemann, who go by the handle Negentropic on the X social media platform, point to BTC's development of a bull flag on the weekly chart. This pattern echoes behaviors observed in the last two bull markets, signaling a potential precursor to a parabolic rise.
“BTC has moved to the 6.618 Fibonacci extension after a bull flag correction. We are currently in a small correction like in late 2017 and late 2020.
Will history rhyme in 2024 – and BTC move to its 6.618 Fib extension in this bull market? That would give us a target of ~$120,000. Time will tell!”
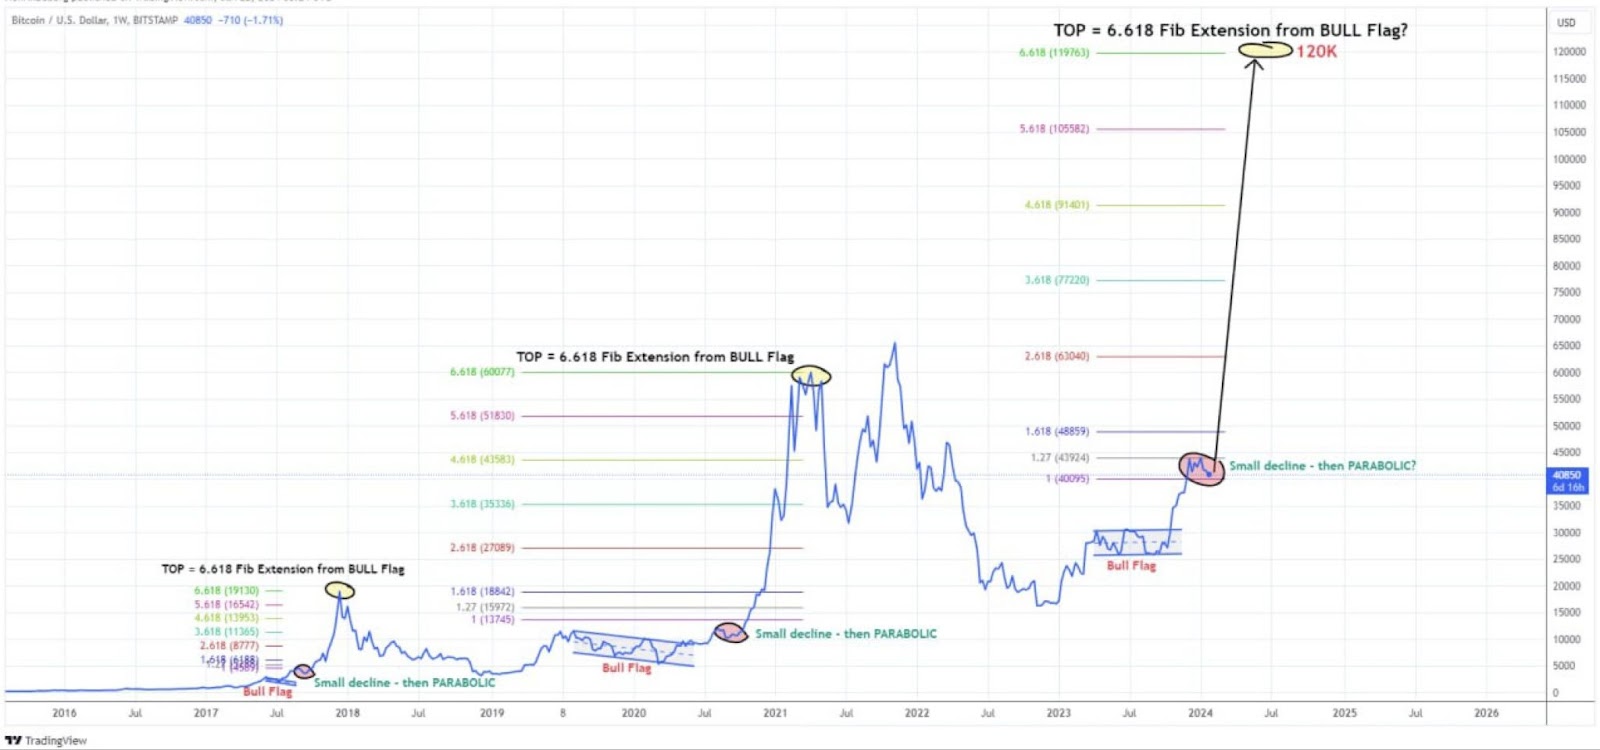
In technical analysis, traders frequently employ Fibonacci extensions to estimate profit targets and anticipate price pullbacks, relying on Fibonacci ratios for insights. The Glassnode co-founders' observation aligns with this method, suggesting that Bitcoin might be gearing up for a substantial upward movement.
Despite this short-term fluctuation, the Glassnode co-founders remain optimistic, not only about Bitcoin but also express bullish sentiment towards equities.
“Trend following is a strong investment strategy! Ask yourself: ‘Why am I bearish equities in the current technical setup?’ Nasdaq has just surpassed former all-time highs. It is above its three-month SMA [simple moving average] and its 12-month SMA. And [its] three-month SMA is above [its] 12-month SMA.
RSI (Relative Strength Index) is at 66 (= strong momentum). MACD (moving average convergence divergence) is bullish and rising. From a trend-following perspective…. why would I expect a crash here?”
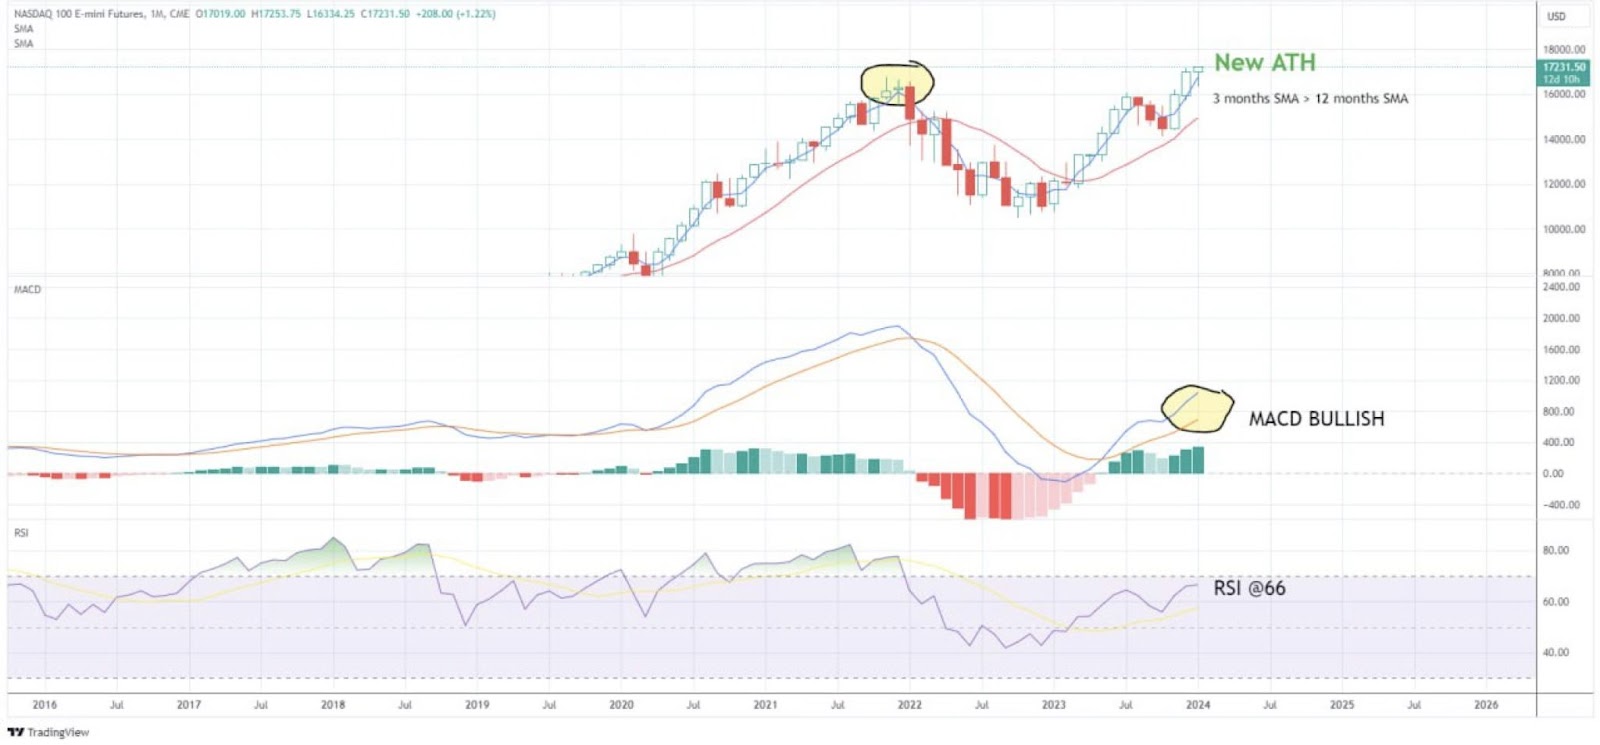
Examining price momentum, the Relative Strength Index (RSI) is a crucial indicator. A reading below 30 suggests oversold conditions, while a level above 70 indicates potential overbought conditions. Concurrently, the Moving Average Convergence Divergence (MACD) is traditionally employed to identify trend reversals and validate ongoing trends.
In summary, Glassnode's co-founders hint at the possibility of Bitcoin mirroring historical patterns, presenting a bullish scenario with potential upward momentum. The technical analysis tools further support their optimistic outlook, offering insights into potential profit targets and trend confirmation.