Golden Cross Emerges on Ethereum Chart — Could History Repeat Itself?
-
 Written by
Simonas Brazionis
Written by
Simonas Brazionis - Updated 2026-02-06 15:11:24
A well-known trader has identified a promising setup for Ethereum with the appearance of a Golden Cross on the 12-hour chart.
In a recent tweet by Merlijn The Trader, this bullish signal is currently active—just like during a previous significant price rally. A Golden Cross happens when the 50-period moving average (MA) crosses above the 200-period MA, often indicating a potential shift to an upward trend.
Table of content
Recap of the Previous Move
Merlijn points out that the last time this pattern occurred, Ethereum experienced:
- A small initial dip
- Followed by a strong price surge on Day 11
Ethereum is currently at Day 10 of this same pattern
Chart Comparison
The tweet includes two charts illustrating similar scenarios:
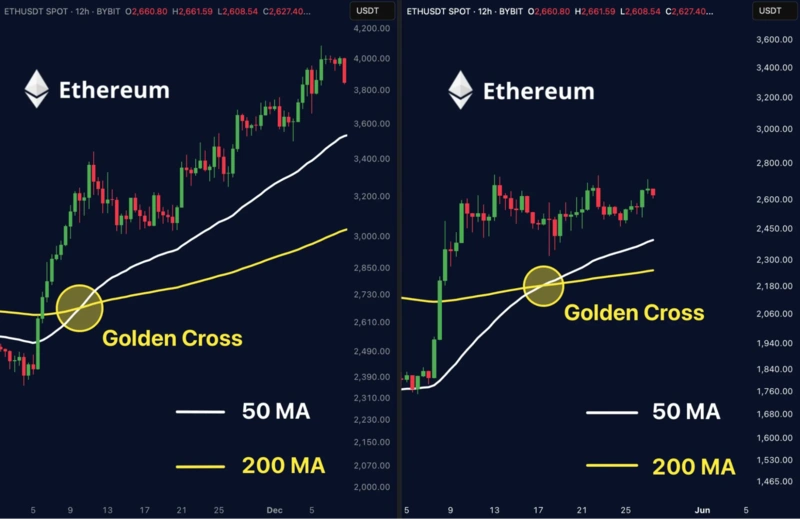
- On the left: the historical Golden Cross leading to a swift rally past $4,000
- On the right: the current 12-hour chart, showing the same crossover forming
Both use the 50 MA (white) and 200 MA (yellow) to confirm the pattern visually.
What Could Happen Next?
Ethereum might see a strong upward move if the pattern repeats as soon as tomorrow. While past trends don’t guarantee future results, this setup is attracting close attention from many traders.