Momentum Trading Strategies
Cryptocurrencies can be volatile, making success in trading them difficult to achieve without a well-thought out strategy and technical analysis.
Momentum trading is an investment strategy that involves purchasing a security when its price rises and selling it once the momentum has slowed or reversed. This method of trading can be a lucrative way to capitalize on short-term market trends and maximize returns.
The plan is flawless. It perfectly parallels the expression “the trend is your friend.” Sure, trading has risk, but momentum trading provides traders more control and lowers potential points of failure.
In this lesson, you'll learn what momentum trading is and the dangers it entails.
Table of content
- What Is Momentum Trading?
- How Does Momentum Trading Work?
- Momentum Investment Principles
- What Are The Features of Momentum Trading?
- The Momentum Strategy Is a Relative Move
- The Momentum Strategy
- Example of a Momentum Trading Strategy
- The Benefits and Drawbacks of Impulse Trading
- What is the difference between Momentum Trading and Scalp Trading?
- Momentum Trading Risk Management
- What Is an Impulse Trader?
- Is Momentum Trading The Kind of Trading You're Looking For?
What Is Momentum Trading?
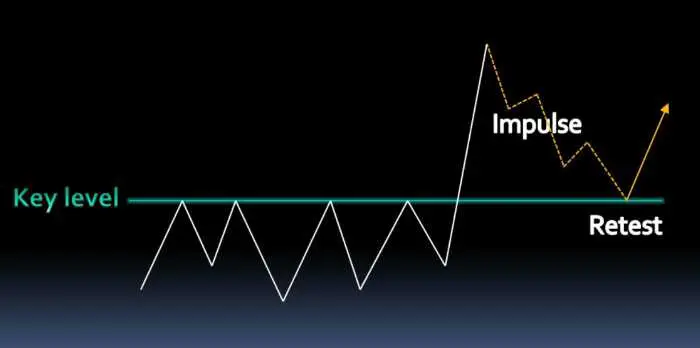
Traders use impulse trading to assess an asset's current trend strength and determine when to buy or sell. The logic behind momentum trading is that if there is enough force pushing price up, it will continue to go in the same direction for a time.
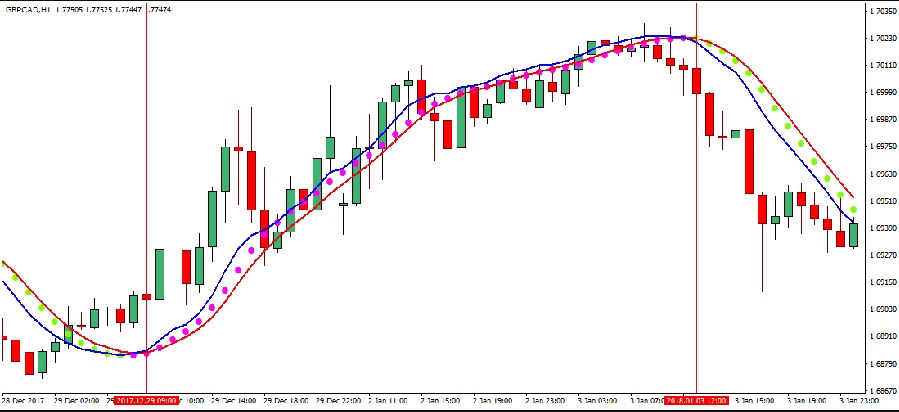
According to trend signals, traders who buy and sell frequently favor volatile markets since they provide opportunities for quick profits by capitalizing on price fluctuations.Trader B places a buy order to join the wave and lock in a profit at an assumed price of $56,000 before the wave collapses, for example. Trader B then used the same momentum trading method in the hopes of catching another wave for the same or other assets.
How Does Momentum Trading Work?
When an object moves in a certain direction, it continues to do so until an external force interferes with its motion and causes it to change course. In trading, the same thing holds – an asset usually travels in one path until something causes the market to react unpredictably.

When a cryptocurrency's value increases, it ignites the interest of both novice and professional traders. This leads to an ongoing appreciation in price – something commonly known as the FOMO effect. The ‘fear of missing out’ that this trend evokes can cause prices to skyrocket beyond what is justified by market fundamentals until eventually there are enough sellers (or whales) who believe it will soon correct itself again.
When the value of an asset starts to drop, that is when short-term traders enter the market in order to capitalize on expected price declines by selling their currency. Momentum trading captures this concept and offers a great opportunity for traders to benefit from these swift changes in the market.

When the market turns, trend traders often hastily liquidate their positions by going short at a rapid pace. This results in them taking an abundance of bearish bets.
Momentum traders can capitalize on the beginning of a new downtrend and exit with substantial earnings when they sense that it's waning. With this two-pronged approach, these investors typically reap considerable profits more times than not!

Momentum Investment Principles
Before initiating any trades, the impulse trader must first fully appraise the trend's strength. Doing so efficiently enables a risk management strategy that accounts for market volatility and fluctuations plus unexpected movements in momentum.
This plan seeks to evaluate three essential components, namely:
Trading Volume
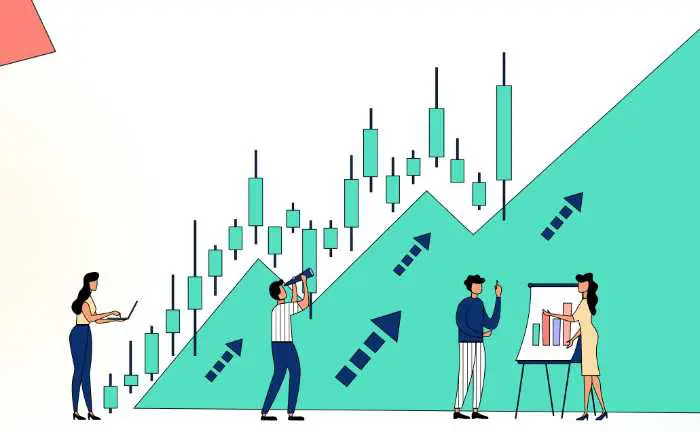
The number of people who are trading in the same direction as the trend can be seen on the volume graph. When there are a lot of assets being traded, it's likely that many traders believe in the trend–giving it more validity. However, whales (term for those with lots of money) can sometimes manipulate trends by buying or selling large quantities of assets; this is why you shouldn't always trust what you see on graphs
Volatility
Traders who seek short-term profits frequently turn to markets with high volatility, such as Bitcoin (BTC) and Ethereum (ETH). By contrast, momentum trading requires astute timing of when one should open or close a trade.
Timeframe Analysis
Ultimately, momentum trading relies heavily upon the timeline decided by the trader because it can only make sense within a specific time. For instance, while bitcoin's price may seem to be increasing hourly, that might just be a brief spike as it decreases in other periods. If several timelines exhibit identical movements then this is regarded as an enduring signal – It's worth taking into consideration!
What Are The Features of Momentum Trading?
Momentum trading can be divided into two distinct strategies – relative momentum and absolute momentum. Traders should keep this in mind as they plan their trades.
The Momentum Strategy Is a Relative Move
Through comparison of asset performance, traders can easily identify securities and assets that yield higher returns, thus enabling them to make more informed investments. This strategic method ensures they are not choosing low-performing stocks or bonds with less lucrative outcomes.
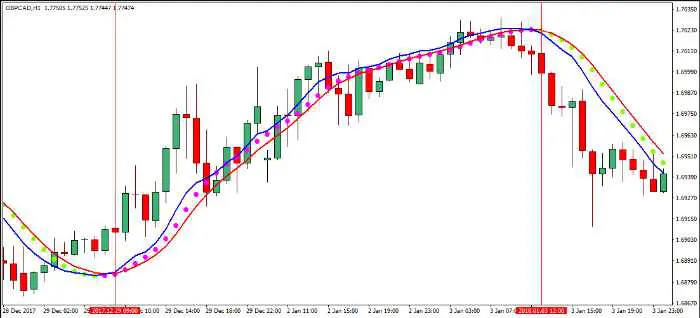
In 2021, NFTs experienced a massive surge in interest from investors and traders alike. This caused them to outperform Bitcoin as well as other crypto competitors. As such, savvy investors who wanted to capitalize on the momentum began investing in Defi tokens related to this new phenomenon.
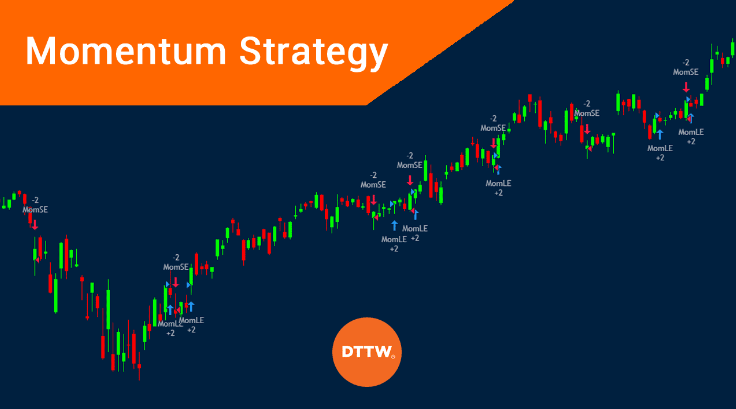
In April 2021, bitcoin reclaimed its dominance and rose to an all-time high of $63,000, while other cryptocurrencies did not perform as well. Momentum traders will choose Bitcoin in this scenario because of its superior momentum.
The Momentum Strategy
When traders evaluate the price of a cryptocurrency or any other asset independently, they compare it to its past performance.

Bitcoin's continued surge to above $61,000 has investors eagerly entering long positions in anticipation of a continuous climb.
The Best Impulse Indicators
Technical analysis is essential for momentum traders since it aids in the detection of the market trend and the creation of trading strategies. Finding your ideal momentum indicator is simple once you've identified one.
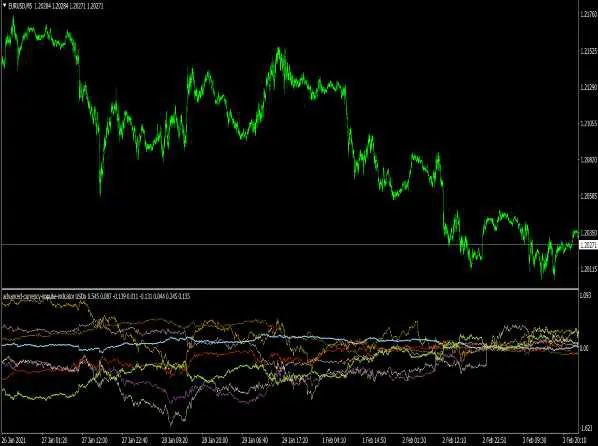
Average Directional Index (ADX)
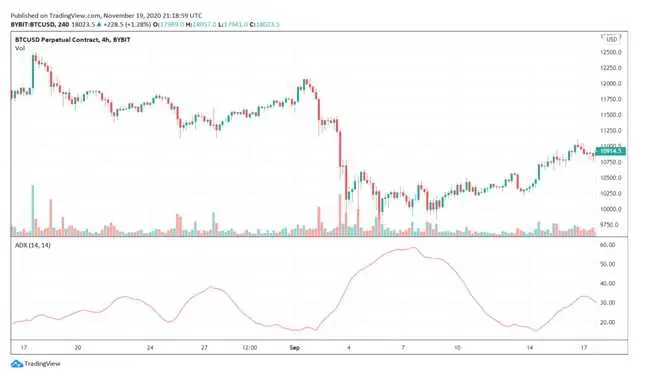
The Average Directional Index (ADX) is a statistical technique used to measure the strength and direction of trends. It is a renowned and straightforward indicator designed to evaluate the strength of an asset's momentum.
The ADX is a great way to track price changes. Although it's complicated, this algorithm works very well when predicting trends. As you can see on any chart, the line oscillates between 0 and 100 when prices are moving in one direction with force — above 30 signals that there is an active trend whereas falling below 30 indicates sideways movement of prices.
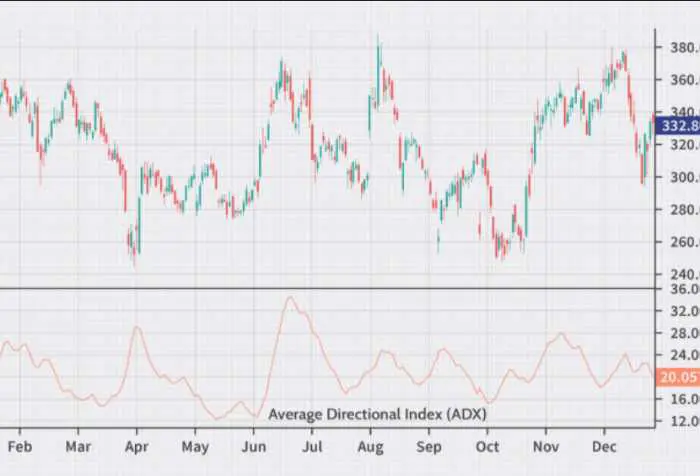
However, bear in mind that the ADX does not indicate whether a trend is bullish or bearish because momentum is all it examines.
Here's what it looks like on the graph:
- Average Directional Index
- Moving Averages
Moving Averages (MAs)
The oldest and most widely used technical indicators are moving averages (MAs). It has been a favorite among traders for decades because it effectively shows the overall trend of an asset by cutting out volatile price action noise.
The Moving Average is a mathematical method used to forecast the price movement of a cryptocurrency over a given period. For momentum traders, moving averages are critical because they can reveal whether the trend continues in its direction or veers off course. Because the moving averages track the price movement, it is easy to see.
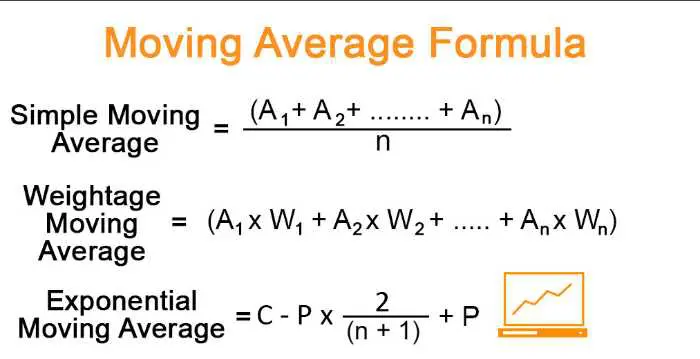
Traders generally employ two MAs with different durations. The current trend may reverse when the shorter MA crosses the longer MA, prompting momentum traders to close positions.
Relative Strength Index
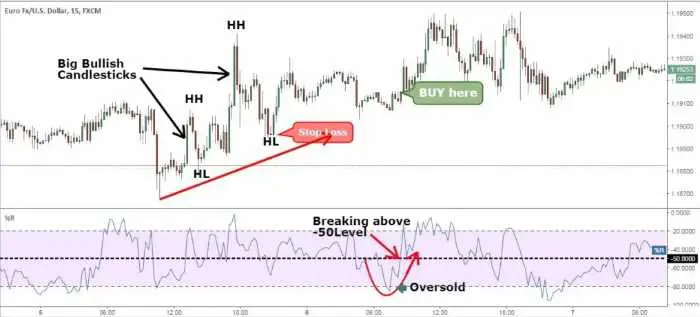
On the daily chart of ETHBTC, the RSI indicator has turned up. The Relative Strength Index (RSI) is a popular momentum indicator that compares the size and degree of past price movements.
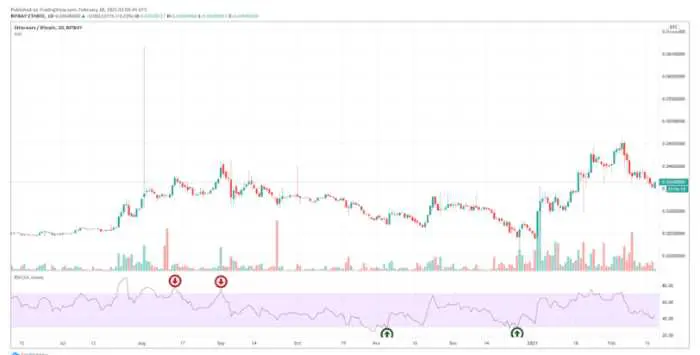
The RSI indicator plots on a separate chart below the price action and ranges 0-100. It falls below zero during oversold levels, which implies that the current downtrend might be reversing soon.
When the RSI is above 70, it indicates that the market is overbought, which means that the current uptrend is losing momentum and may gradually turn into a downtrend or trend horizontally. Momentum traders should be on the lookout for when the RSI rises above 70 or falls below 30, as bullish or bearish sentiment reaches overdone extremes.
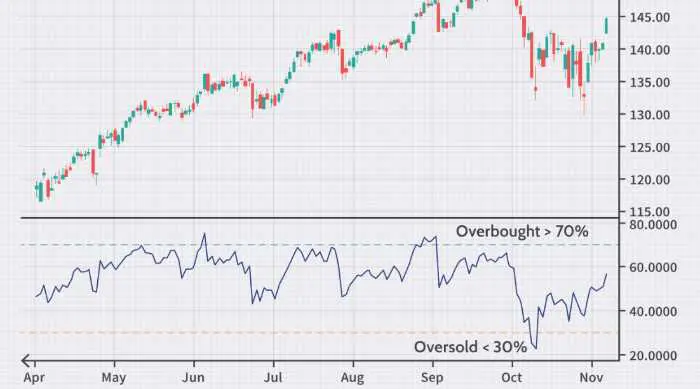
Trading with the Momentum Indicator is one of the most widely adopted practices amongst professional traders, as this tool helps measure momentum accurately and efficiently.
MACD
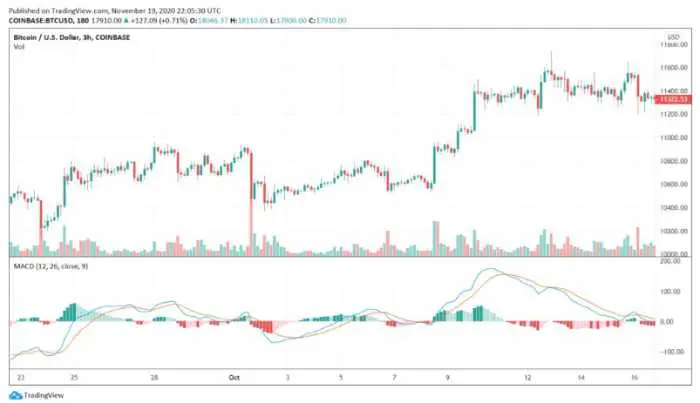
The MACD is used to identify the direction of a trend. In contrast, the MACD can be a bit trickier to understand. It works both as an impulse indicator and a trend-following one. The MACD collects two exponential moving averages (EMAs) that it subtracts from each other – specifically, 26-period EMA subtracted by 12-period EMA – to provide its result.
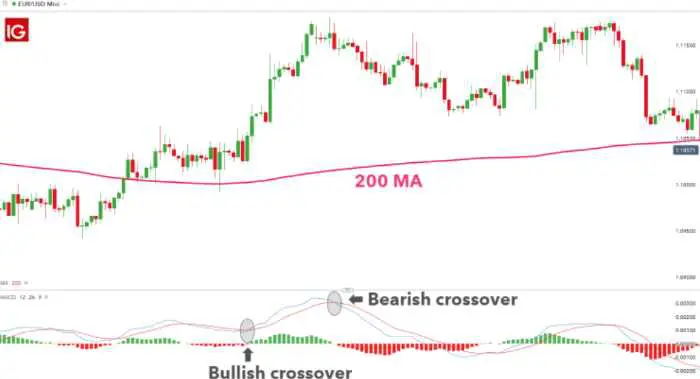
The MACD indicator was created to identify three EMA lines over a designated period. However, instead of the EMAs originally intended for use with the indicator, two different lines are now visible on the chart. The MACD line is one of these altered lines, whose purpose is to signal price momentum changes and provide buy or sell indications.
Traders anticipate that the current trend will continue when the two lines get further apart, as momentum is considered more significant.
Stochastic
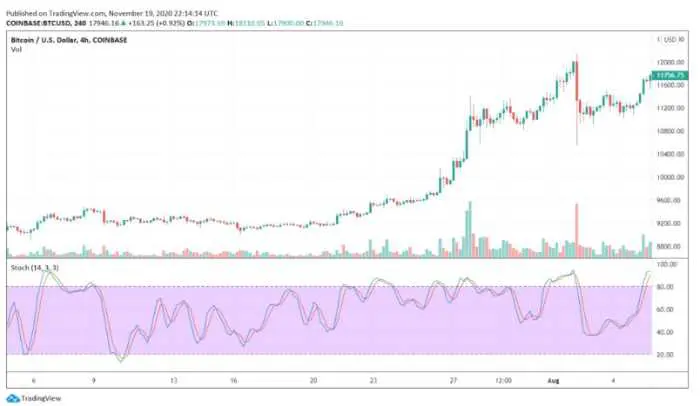
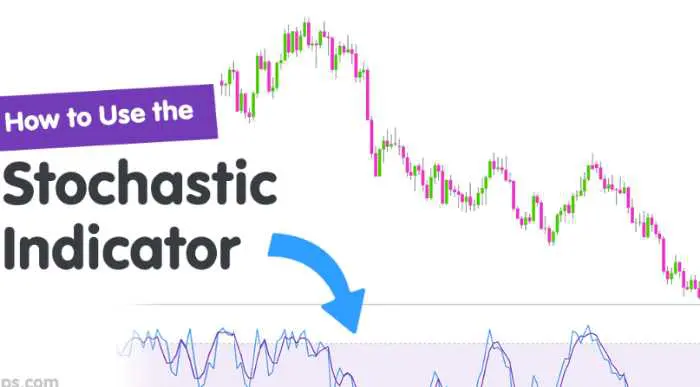
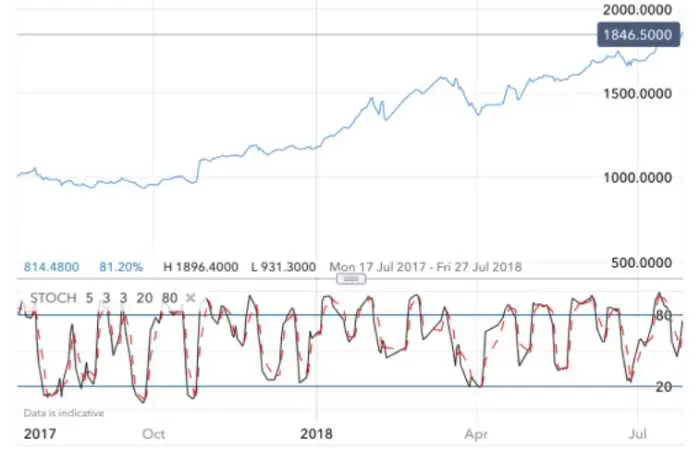
Stochastic is a preferred indicator for both momentum and swing trading. Despite the fact that it has similar features to RSI, its computation technique differs significantly. Basically, the indicator gauges the most recent closing cost against the range of prices during an identified window of time.
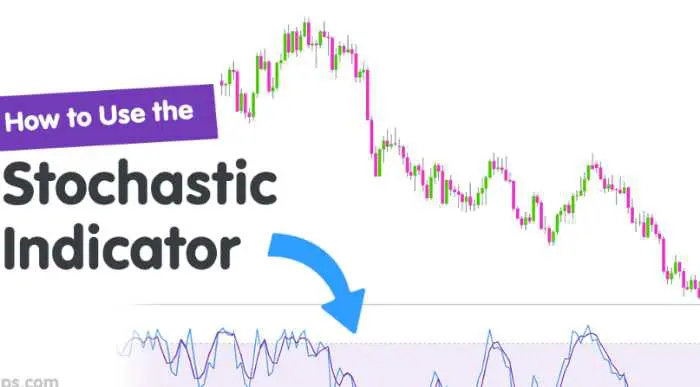
Stochastic is a momentum indicator that was originally designed by Renko as an alternative to the RSI. It ranges in value from 0 to 100, similar to the way RSI does, but it is plotted on a separate chart. Stochastic also indicates overbought and oversold conditions, though they are considered to be 80 or above and 20 or below respectively.
Traders would be particularly keen to exit the market when the two lines cross or when the indicator remains within overbought or oversold regions, as this shows that it is a trading opportunity.
Commodity Channel Index (CCI)
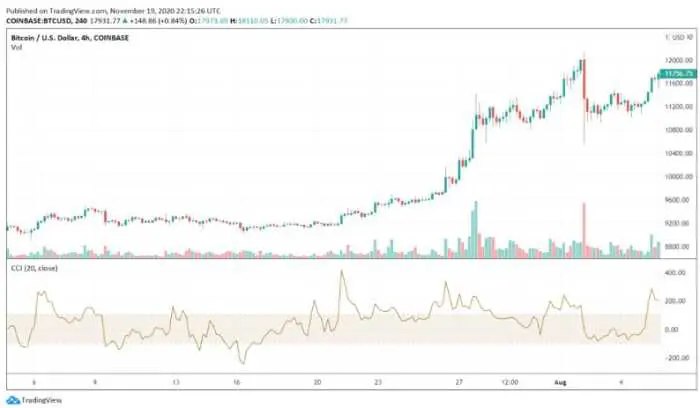
By utilizing the Commodity Channel Index (CCI), you can easily determine whether a market is on an uptrend or downtrend. It is a momentum indicator that measures the movement of prices. The difference between the current price and the average historical price for a certain period is calculated by this indicator.
When the CCI is greater than zero and centered on the chart, it implies that the price has risen above its historical average.
The price is considered to be below average when the CCI is less than zero. When the CCI rises above 100, it indicates that the price is considerably above its historical average and the uptrend has strength.
Stochastic Momentum Index (SMI)
Developed by a Wall Street veteran from Goldman Sachs, the Stochastic Momentum Index is an invaluable tool for traders.
The Stochastic Momentum Index (SMI) provides a more precise indication of overbought and oversold levels by delving deeper into closing prices to assess the difference between present pricing and recent highs/lows. This modernized version of the traditional Stochastic indicator is an invaluable tool in any trader's arsenal.
Example of a Momentum Trading Strategy
If you're looking for a successful trading strategy, many momentum techniques draw on several distinct technical indicators and chart patterns to render buying or selling advice. This basic method has proven itself to be remarkably effective – give it a shot!
To successfully utilize the EMA and ADX indicators, set them to 19 days each.
Impulse Trading System
Here are the buying conditions:
- Check to see whether the ADX is above 30 – this indicates that the market is on a trend.
- Look at the EMA to see if it's pointing up, which indicates an upwards trend.
- Wait for the candle to become entirely above the EMA and then open a long position.
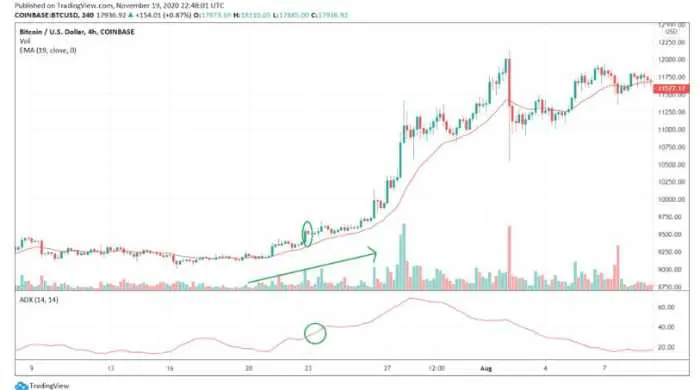
As soon as the EMA is crossed, it's time to manually exit the market. Don't forget to keep an eye on volume levels – higher volumes suggest a greater momentum and signal that the market trend will most likely persist in its direction.
Demands extensive effort and boundless patience.
Trading Strategy-2
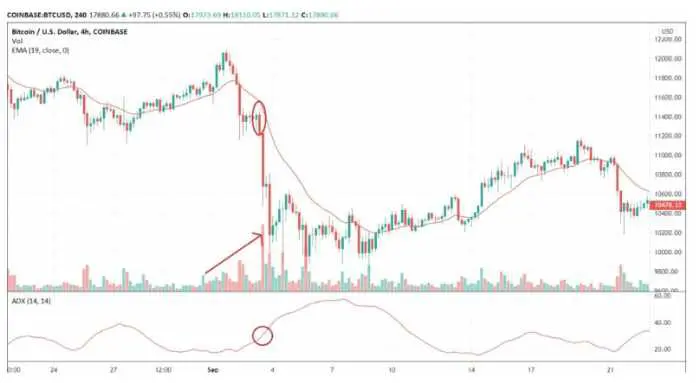
This method comes with certain conditions which must be met:
- Is the ADX at or over 30? The ADX indicates the trend's strength, not its direction.
- Is the EMA pointing down? A downward-pointing EMA signalizes a bearish trend.
- Enter the market after the first candle that closes below the EMA with its entire body and shadows.
The Benefits and Drawbacks of Impulse Trading
This trading technique is straightforward, making it ideal for beginners. What's more, momentum trading can be quite profitable if you time it correctly. Additionally, it works well on all timeframes, so both day traders and swing traders can benefit from using this approach.
On the other side, momentum trading is a high-risk strategy since it is entirely reliant on market information and movements. Traders might be taken by surprise by unexpected trend reversals. Momentum trading isn't appropriate for levered assets because of the intricate underlying futures markets.
In addition, price swings may occur without prior warning owing to unanticipated events or significant whale transactions.
What is the difference between Momentum Trading and Scalp Trading?
Good scalp traders make money off of momentum stocks by taking advantage of small price changes during a stock's larger movement. Scalping modifies the approach to risk management by focusing more heavily on the probability component of the equation.
As a result, scalpers will take on a greater risk in exchange for lower reward since it is more likely their price target will be reached before the stop-loss.
Scalpers measure risk by sharing position size tempered by holding time. With a 3:1 risk-to-reward trade, you'd have the potential to lose $300 versus making a $100 profit. Even though there's a 90% chance you'll lose money first (triggering the stop loss), this is still a viable option because of the high probability of making $100.
To elaborate, a scalper frequently has stop-losses at breakeven to have time to reenter when the odds rise again. This agility is shown by experienced scalpers who trade stocks with momentum.
Momentum Trading Risk Management
You must use good risk management methods and adhere to your chosen strategy to be successful in momentum trading.
Here are a few things to think about:
- When a trader enters the market, they must decide whether to enter via the 50 or 200-day moving average. I recommend that you use the entry point at or near the middle of either one (noting that it may be more aggressive than anticipated if there is an extended upward momentum).
- Don't forget to keep an eye on the trend's support and resistance lines. If you have long investments and the uptrend breaches a support level, be ready to act.
- Check your positions regularly. It's best to focus on volume and volatility. If the volume is declining, it may indicate that traders no longer wish to support the current trend and are waiting for a reversal.
- The exit point is just as important as the entry point when trading. If you see a trend beginning to reverse, close your trades immediately. Some indicators that this may be happening are moving average crosses or overbought/oversold levels shown by the Stochastic and RSI indicators.
What Is an Impulse Trader?
Equip yourself with the necessary analytical tools and risk management strategies to ensure sustained success. Gain insight into financial statements, comprehend the key forces of a business, create an effective approach for stock market analysis which includes fundamental and technical assessment techniques – all essential resources you can use to become proficient in your own investments.
- Figure out which cryptocurrency you want to invest your money in, such as bitcoin or altcoin. You can use a momentum strategy like the one mentioned earlier to help make your decision.
- Create an impulse trading strategy based on the indicators described or, if you prefer, use a pre-made one like the one mentioned above. It's crucial to keep to it when live trading.
- Test your plan on a demo account and on past price data in the chart to ensure that it delivers accurate indications.
- Start investing in real markets, putting as much as you can afford to lose, and then make adjustments when you're comfortable.
Is Momentum Trading The Kind of Trading You're Looking For?
In general, momentum trading is a form of universal strategy that is suitable for both beginners and experienced traders. It works well on all timeframes above H30. While momentum trading can be useful for both day traders and swing traders, it is important to remember that your overall investment strategy should be diverse. This will help ensure that you are prepared for all eventualities and that you do not put all of your eggs in one basket.
Another advantage is that momentum trading is aided by several technical indicators that have been created exclusively to measure the trend's strength.


